Data Analysis and Probability
A Step by Step process.

Data analysis and probability offers your child the chance to apply real life situations to mathematics. It can also be a lot of fun for the artist in your family!
Here you will find hints and tips to home tutor your child
What is Data Analysis and Probability?
|
Data Analysis is the gathering and methods of representing your information, and interpreting the information. Probability is a method of calculating the likleyhood of something happening based on the information you already have. |
|
Data models are all around us. They are used in advertising, sporting events and even tracking your childs progress in school. It is used by scientists to track patterns in nature and nurses to track information such as a patients’ temperature, or change in temperature.
Expose your child to examples of data displays from magazines or newspapers.
The Steps Involved in the Process
Gathering data (or facts) on a particular subject.
1. What information do you want to know?
2. What questions do you need to ask?
3. Ask the questions to get the answers.
4. Decide on a method of displaying your results!
Presenting that data in a format that has a visual impact that offers an uncomplicated method of interpreting the facts.
This is where familiarity, use and practice with the different types of graphs used in the elementary math curricula is very important.
One graph doesn't fit all, although with many of the simpler elementary graphing, Pi Chart, Bar Graphs and scatter plots do tend to be the most commonly used.
Interpretation of the data.In
Much of the time when we are given statistical information, we have in fact been given the creators interpretation of the information. Though the values tend to be very close, Median and Mean figures have different meanings.
Your student will have to solidify the skill of averaging numbers, estimating outcomes and deciding upon ranges, while completing Data Analysis projects.
How can you help your student in this area?
There are many different activities in real life that you can get your child involved in. This will help them appreciate the applications of data analysis and probability in their surroundings.
It will also teach them the value of data analysis and probability.
So how can you make the learning process of data analysis and probability fun for your child?
Introduce it through an activity built around a subject they are already interested in. A sport, nature, toys, If you go to the park or beach, encourage them to track different information in their math journal. When you get home you could have hours of math projects from one great trip!
Keep In Touch!
You can send me a quick message, subscribe to K6Math Fun & Update, or join my Facebook Page - K6Math. Choose all the options so you don't miss any of the new material added to this site.
JOIN THE CONVERSATION ON FACEBOOK
Recent Articles
-
Printable Math Worksheets you need for your K-6 Student, and Much More
May 18, 17 04:07 PM
A comprehensive Resource of Printable Math Worksheets and Parent Tuition Material
-
Easter Tangram Fun - Free and Printable!
Apr 07, 17 04:46 PM

Use this Magic Egg Tangram to hatch your very own Easter Egg Chicks!
-
Place Value Chart to the Billions
Sep 26, 16 03:37 AM
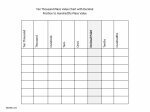
Find the perfect Place Value Chart for your needs here, from hundreds to billions
